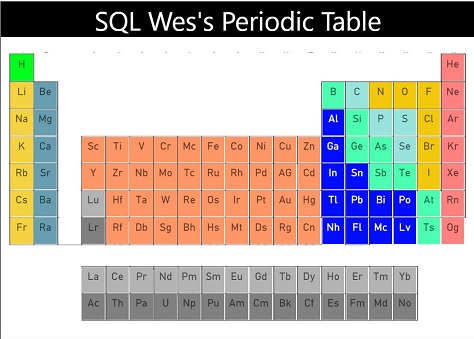
The SQL Wes Periodic Table Synoptic Panel

Wow! It’s been a looong time since I’ve posted a new blog entry. A few things have happened. I’m now a Premier Field Engineer at Microsoft, working with SQL Server, PowerBI and Business Intelligence in general. In the past 2 years, PowerBI has come a long way as well. I just created a Synoptic Panel for the Periodic Table of elements using OKViz’s Synoptic Design custom visual for PowerBI and I wanted to share it with the community. I used a basic Periodic Table image and then used the online tool found at their site to map out all of the element locations. This generated an .svg file that I combined with the .pbiviz file and a few mock up records from excel for my imaginary compounds. You won’t be able to refresh the excel data but I wanted to include those to show you how to tie the values stored in the .svg with the data you might include.
I’ve attached the .pbix file as well as embedded the report below and included a link to the report url. The embedded report does not really fit well into my blog site format but I wanted to show how the embedded iframe works as well as the link. The report itself is just a sample of how you might use the visualization. You’ll need to add your own data to make it really useful. Let me know what you think.
SQL Wes’s Periodic Table Synoptic Panel
Link to .pbix file
SEO has told me I need to include the keyword a few more times so, The SQL Wes Periodic Table of Elements is brought you by The SQL Wes Periodic Table of Elements, a division of The SQL Wes Periodic Table of Elements project in cooperation with the greater The SQL Wes Periodic Table of Elements council.