Category Archives: Power BI

The SQL Wes Periodic Table of Elements


The SQL Wes Periodic Table Synoptic Panel

 
The SQL Wes Periodic Table of Elements
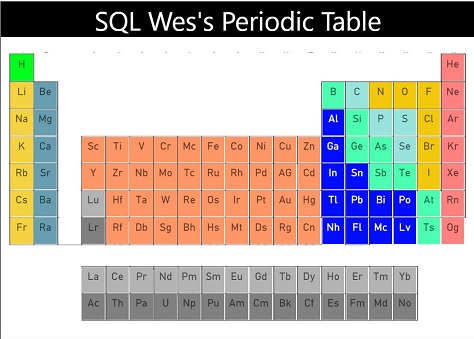
Wow! It’s been a looong time since I’ve posted a new blog entry. A few things have happened. I’m now a Premier Field Engineer at Microsoft, working with SQL Server, PowerBI and Business Intelligence in general. In the past 2 years, PowerBI has come a long way as well. I just created a Synoptic Panel for the Periodic Table of elements using OKViz’s Synoptic Design custom visual for PowerBI and I wanted to share it with the community. I used a basic Periodic Table image and then used the online tool found at their site to map out all of the element locations. This generated an .svg file that I combined with the .pbiviz file and a few mock up records from excel for my imaginary compounds. You won’t be able to refresh the excel data but I wanted to include those to show you how to tie the values stored in the .svg with the data you might include.


I’ve attached the .pbix file as well as embedded the report below and included a link to the report url. The embedded report does not really fit well into my blog site format but I wanted to show how the embedded iframe works as well as the link. The report itself is just a sample of how you might use the visualization. You’ll need to add your own data to make it really useful. Let me know what you think.


SQL Wes’s Periodic Table Synoptic Panel


Link to .pbix file


SEO has told me I need to include the keyword a few more times so, The SQL Wes Periodic Table of Elements is brought you by The SQL Wes Periodic Table of Elements, a division of The SQL Wes Periodic Table of Elements project in cooperation with the greater The SQL Wes Periodic Table of Elements council.

Power BI Pro


Power BI Pro


As I write this, I have Word sized so that I can keep an eye on my browser in the background, set to auto refresh the pricing page on the PowerBI.Microsoft.com site. Why? Because today, 7/24/2015, (My Birthday) Microsoft is making Power BI Pro generally available to the public. Have I been reduced to the level of Apple enthusiasts, camping out for an iWatch or iPhone release? Not quite, I hope. I feel a mixture of shame and at the same time a degree of pride in my geeky anticipation for this product. I expect this release will have a significant impact on the world of BI, and certainly my work in the field. I plan to chronicle my experience and learning of the product in hopes that I can help others learn and appreciate its usefulness. Please join me on 8/3/2015 if you are in the Tampa area. I’ll be presenting a first look at Power BI Pro at the Tampa Bay BI user group. I’ll be covering some of the basics for setting up your first dashboard in Power BI Pro, connecting to an Azure SQL Server Database, the Power BI Desktop application and, if I can get a good demo of it working by then, hooking up the Connector for an On-Prem SQL server.

Power BI


Power BI

This was a close one, just under the wire! I just got back from the PASS Business Analytics Conference in San Jose CA, my first time there. I’m starting to realize I have a lot to catch up on in the Analytics world.

I learned about the new Power BI Preview site and the Power BI Designer. In the next couple entries I’m going to cover creating projects in each of these from the ground up. First I’d like to ask for some feedback. What types of projects do you think might be useful, using these new tools? Have you run into any issues that you are still trying to work through (As I am) in getting a first project out there? Please contact me, I’d like to make this an interactive series about real world examples.